Aurora tonight: will you see the northern lights?
An automatic, plain-English read of NOAA's geomagnetic forecast for the next 48 hours, aimed at US, Canadian, European and Southern Hemisphere viewers. Updated Fri Nov 20, 16:09 UTC · 11:09 AM ET · 9:09 AM MT · 8:09 AM PT.
NOAA aurora maps for tonight and tomorrow night
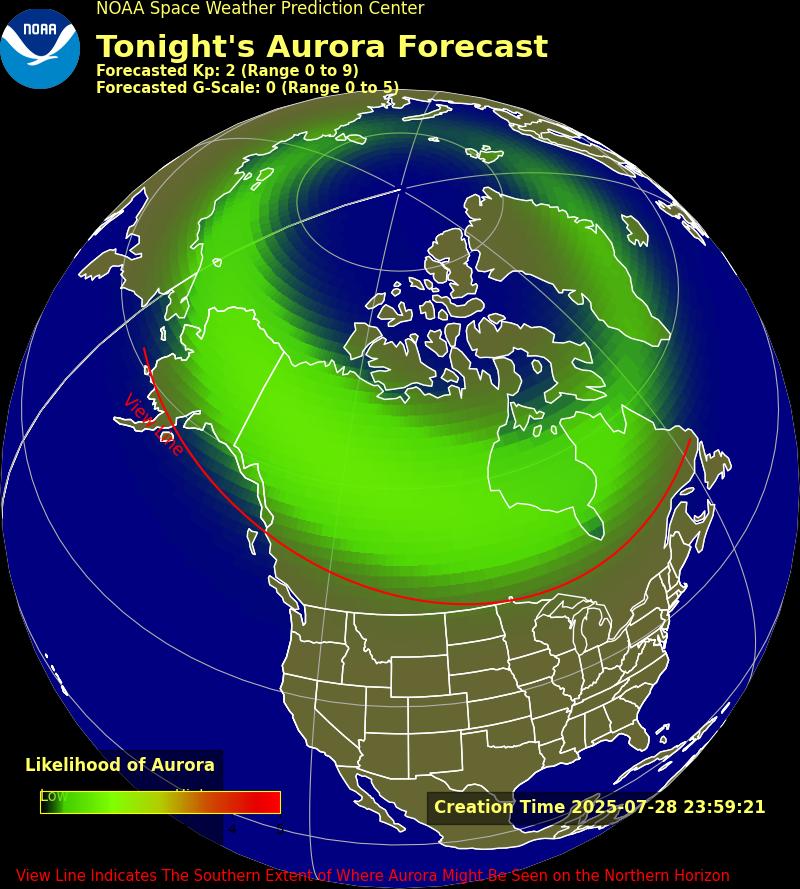
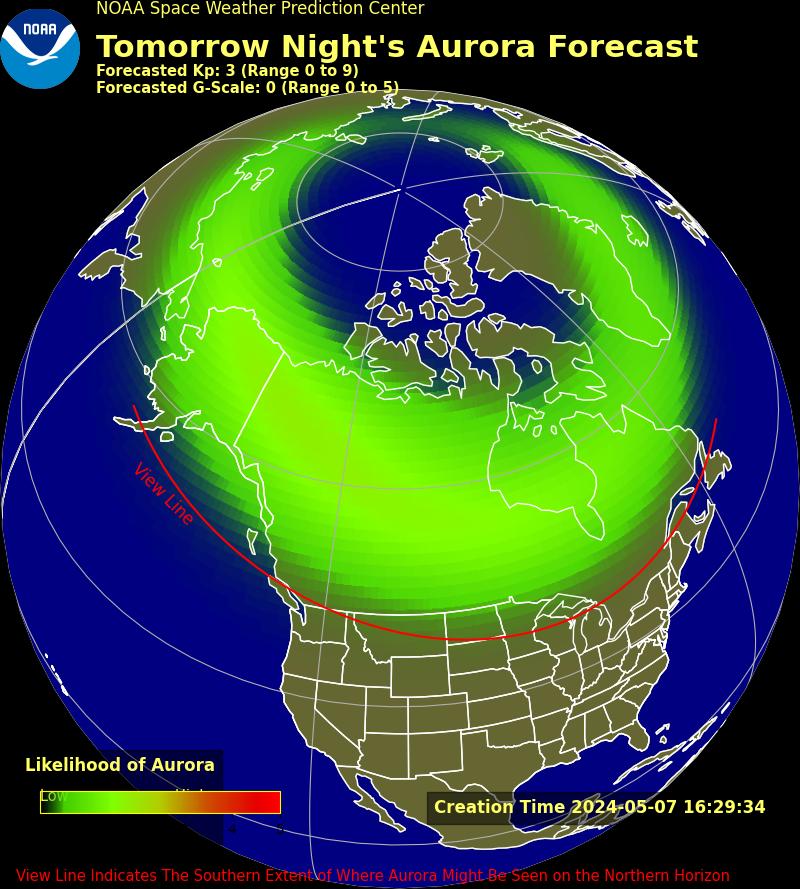
Brighter green means a better chance of aurora, and the oval turns red when NOAA expects a stronger show. You do not have to be under the oval: NOAA says bright aurora can be seen from up to about 1,000 km (about 600 miles) away when skies are dark and clear. Each map covers 6 PM to 6 AM US Central time. NOAA moves both maps ahead one night at 12:00 UTC (7 AM ET); our night labels were set when this page was built (Fri Nov 20, 16:09 UTC · 11:09 AM ET · 9:09 AM MT · 8:09 AM PT). The creation time NOAA prints on each map is in UTC.
Maps: NOAA Space Weather Prediction Center, Aurora Dashboard (experimental), OVATION model. Public domain, US government work. Shown directly from NOAA's server.
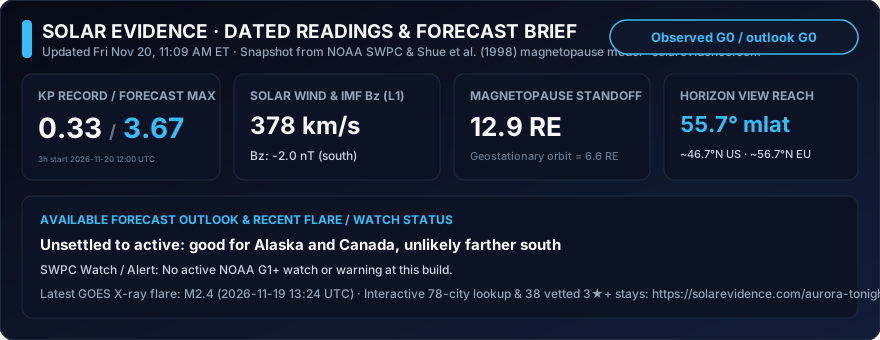
Official NOAA G scale is G0. No active dated alert, warning, or watch is shown. G0 is below storm level; it is not a claim that Kp is at traditional quiet levels.
Latest official 3-hour Kp record: Kp 0.33 (observed), UTC block start Fri Nov 20, 12:00 UTC · 7:00 AM ET · 5:00 AM MT · 4:00 AM PT, block-start age 249.5 minutes. Not instantaneous, not the minute estimate, and not NOAA's official storm scale. NOAA's estimated Kp for the current 3-hour block is 2.67 (an estimate, not an official record).
Brighter, more active aurora is possible at high latitudes such as Alaska and Canada. A sighting from most of the contiguous US is unlikely at this level.
Viewing-planning basis: the higher of NOAA's latest estimated Kp for a 3-hour UTC block (block starting Fri Nov 20, 15:00 UTC · 10:00 AM ET · 8:00 AM MT · 7:00 AM PT, source age 69.5 minutes) and the highest available forecast block (3.67). The six-hour ceiling is a site retention/eligibility policy, not certification of current conditions. This is a viewing-planning index, not NOAA's observed storm level; the outlook badge uses forecast values only. Forecast coverage is Fri Nov 20, 15:00 UTC · 10:00 AM ET · 8:00 AM MT · 7:00 AM PT through Sun Nov 22, 18:00 UTC · 1:00 PM ET · 11:00 AM MT · 10:00 AM PT; this is partial coverage, not certification of a full next 48 hours.
Latest available minute Kp estimate: 0.33, source Nov 20, 16:04 UTC · 11:04 AM ET · 9:04 AM MT · 8:04 AM PT, age 5.5 minutes at build (provisional; not the 3-hour record). Retrieval/build time Fri Nov 20, 16:09 UTC · 11:09 AM ET · 9:09 AM MT · 8:09 AM PT is separate from source measurement time.
Latest available official scale sample: G0/S0/R0, source Nov 20, 16:08 UTC · 11:08 AM ET · 9:08 AM MT · 8:08 AM PT, age 1.5 minutes at build. Retrieval/build time Fri Nov 20, 16:09 UTC · 11:09 AM ET · 9:09 AM MT · 8:09 AM PT is separate; a younger dated sample is not certification of current conditions.
Latest official 3-hour Kp record
Highest available Kp forecast (up to 48 h)
Dated official NOAA scale sample
Browse Live Tonight Status by State, Province & Region (28 Guides)
Select your state, province, or country below for a dedicated live-updated tonight status card, local city Kp thresholds, dark-sky parks, seasonal cloud patterns, and camera settings:
US States
Canada
Europe & UK
Southern Hemisphere
Kp by 3-hour block: record type and UTC/EST start
UTC first, with local zones. Predicted blocks use the issued NOAA 3-day text forecast (issued Fri Nov 20, 12:30 UTC · 7:30 AM ET · 5:30 AM MT · 4:30 AM PT; retrieved 2026-11-20T16:09:29+00:00); observed/estimated blocks retain their JSON record types.
Forecast source policy: following a recorded Nov 6 disagreement, this site provisionally uses NOAA's issued 3-day text for forecast blocks. The 24-hour issue-age limit is a site safety cutoff, not a NOAA freshness standard. Missing or invalid forecast data means unavailable, not G0.
Historical source disagreement recorded Nov 6: the then-issued text gave Nov 7 00–03 UTC (Nov 6 7–10 PM EST) Kp 5 and 03–06 UTC (10 PM Nov 6–1 AM Nov 7 EST) Kp 4; the separately retrieved JSON gave 4 and 5 at those same UTC keys. This table uses the issued text for predictions, not a time shift. NOAA’s reason for the difference is unknown.
Each block starts at the time shown and lasts 3 hours. "Observed" is a reported 3-hour record; "estimated" is a provisional block estimate, not a completed observation or the minute-by-minute estimate. "Predicted" is the issued text forecast. Different NOAA products can disagree; we do not shift their timestamps to force a match. Forecast rows show available 3-hour intervals that overlap the next 48 hours, including an interval already in progress. Full source intervals are shown unchanged, so their start may be before now or their end beyond that window. Ended forecast intervals are excluded. An ongoing forecast is not an observation. Gaps or partial coverage do not imply quiet conditions. Data: NOAA SWPC issued 3-day forecast (U.S. government work, public domain).
Active NOAA alerts, warnings and watches
- No geomagnetic warnings or watches are currently in effect, and no alerts were issued in the last 24 hours.
Our short summaries of NOAA SWPC products (U.S. government work, public domain); headlines quoted from NOAA. Read the full official text on the SWPC alerts page.
What the aurora looks like
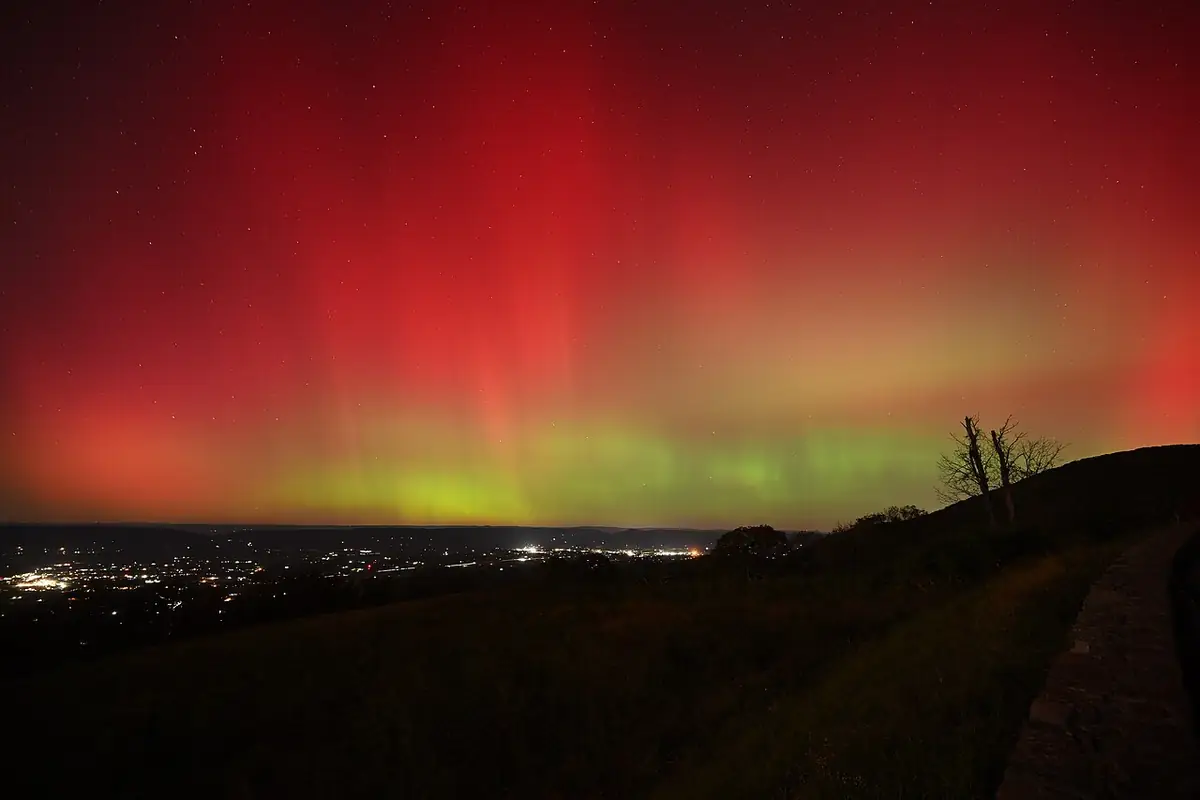
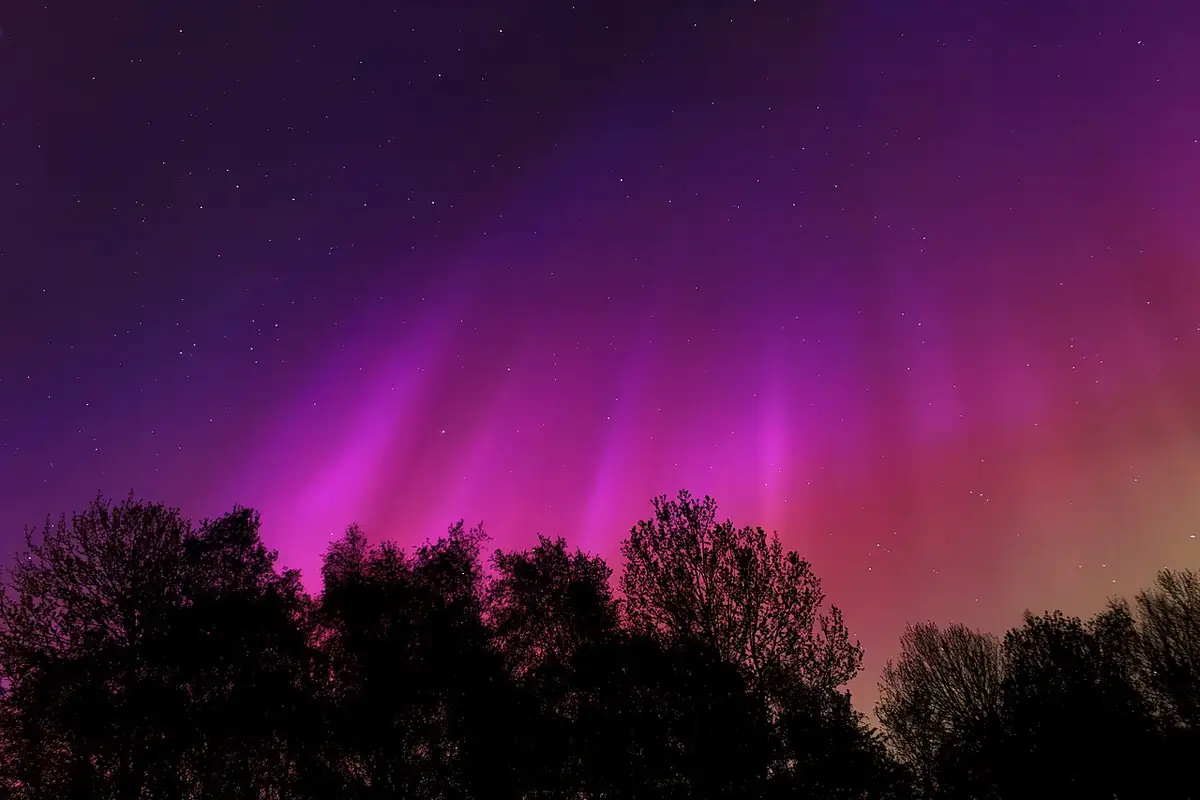
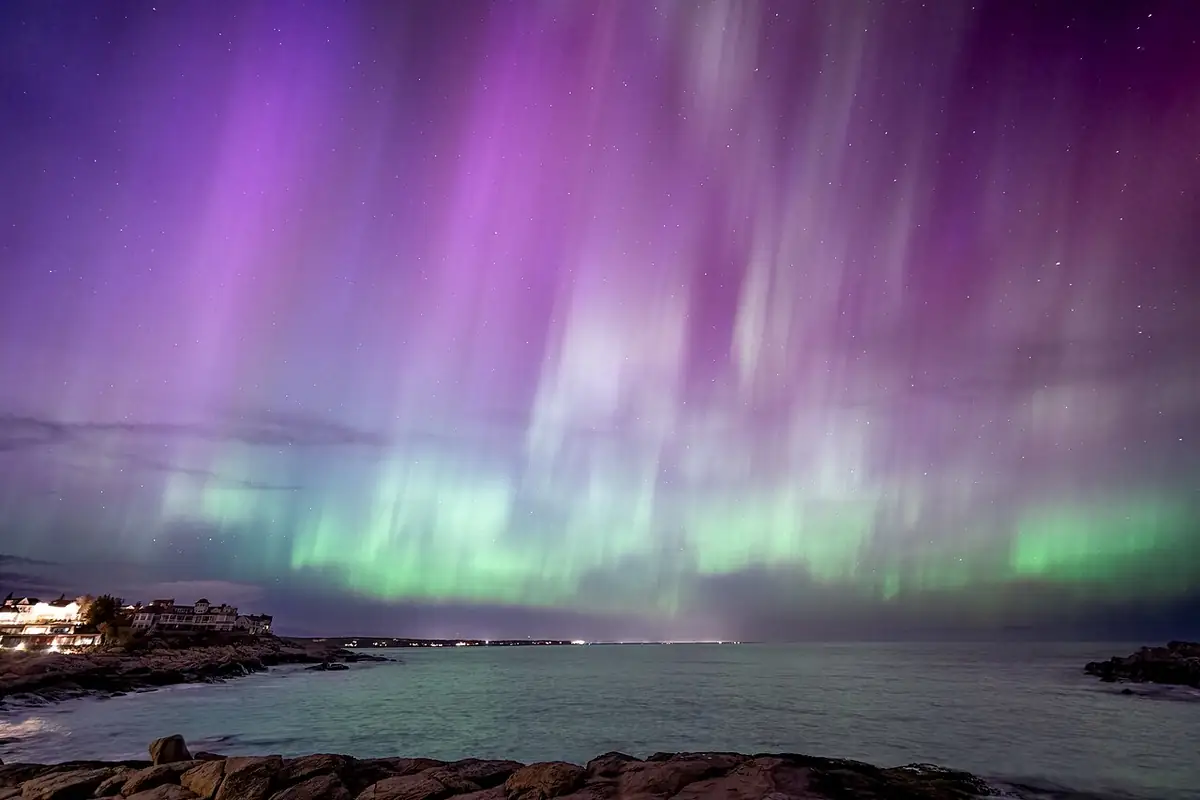
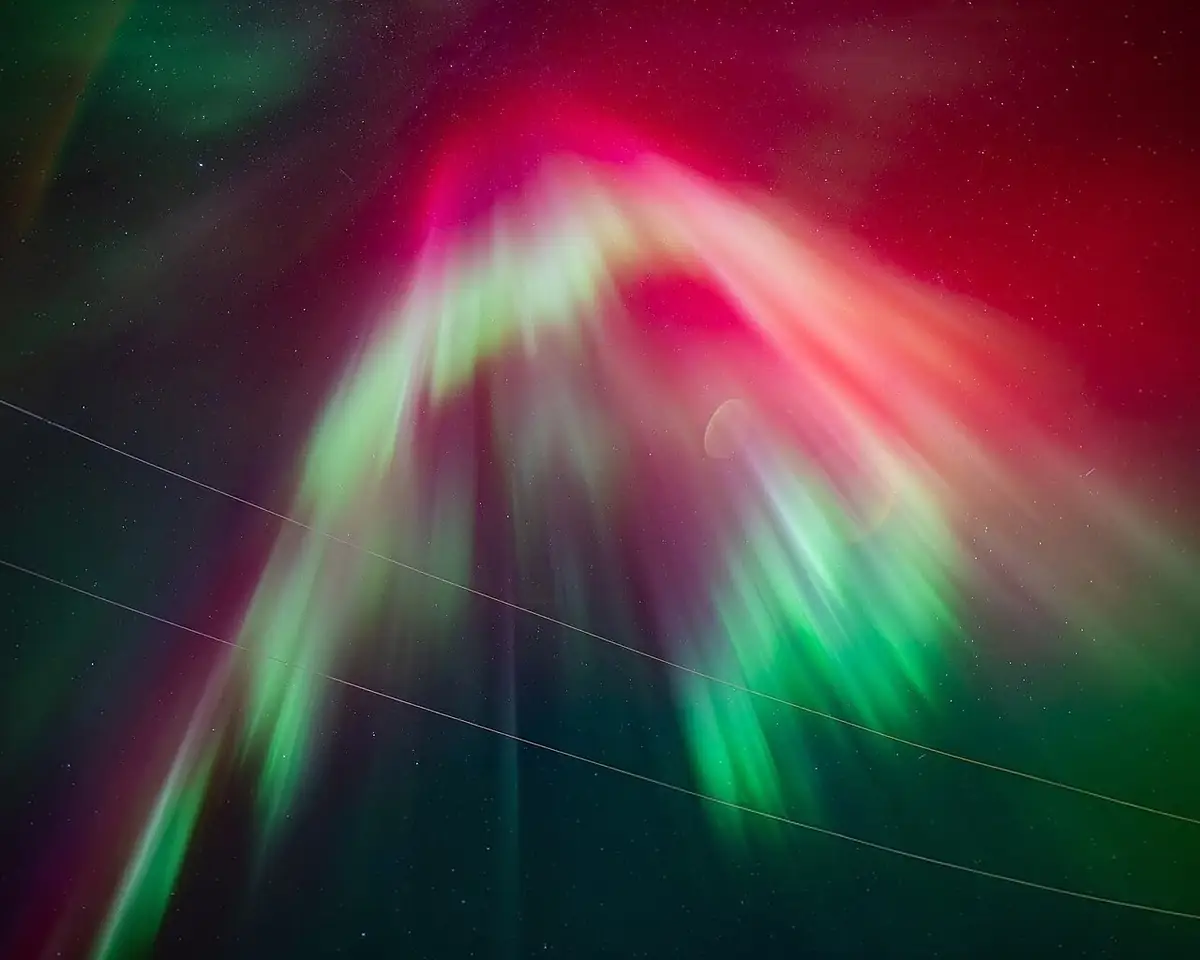
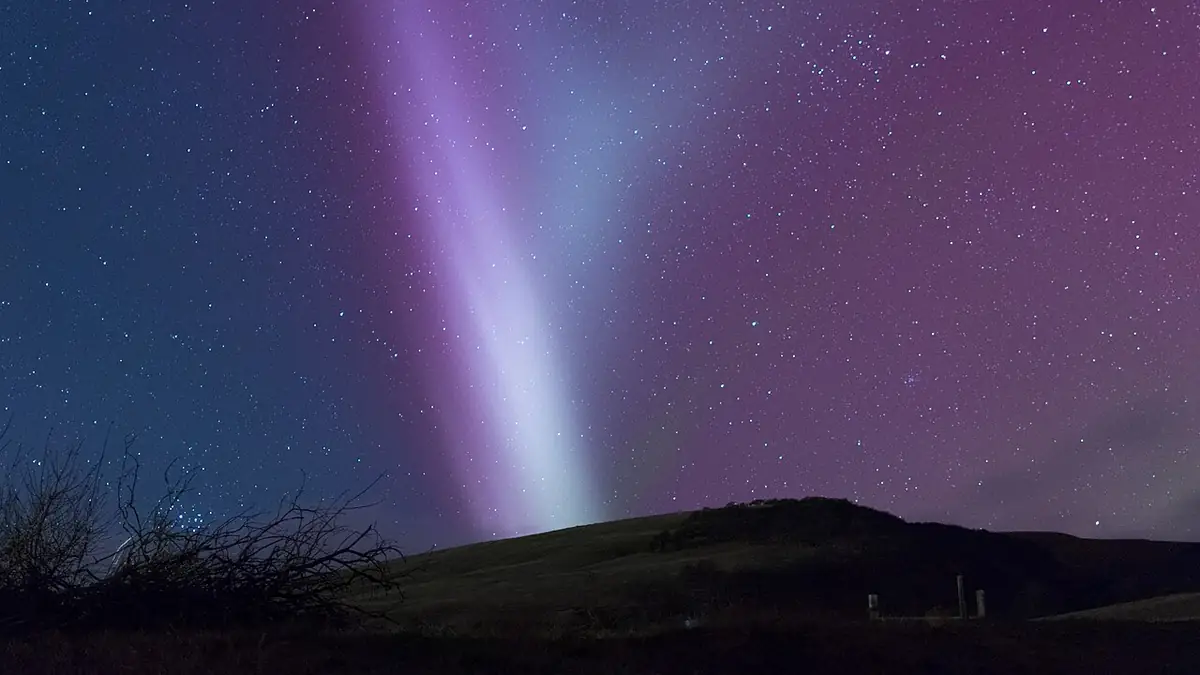
Aurora colours come from the gas that is struck and from its height. Oxygen above about 200 km glows red; oxygen at about 100 to 200 km glows green, the most common colour; nitrogen at about 100 to 200 km gives blue; and nitrogen below about 100 km glows pink, often along the lower edge of a bright curtain. Where these mix, the sky can look purple, magenta or white. Cameras often record faint red and purple more strongly than the eye sees. Tap any photo to enlarge it. Sources: NASA Science, Auroras (colour and altitude table); NOAA SWPC, Aurora; on STEVE, AGU (Gallardo-Lacourt et al., 2018) and NASA.
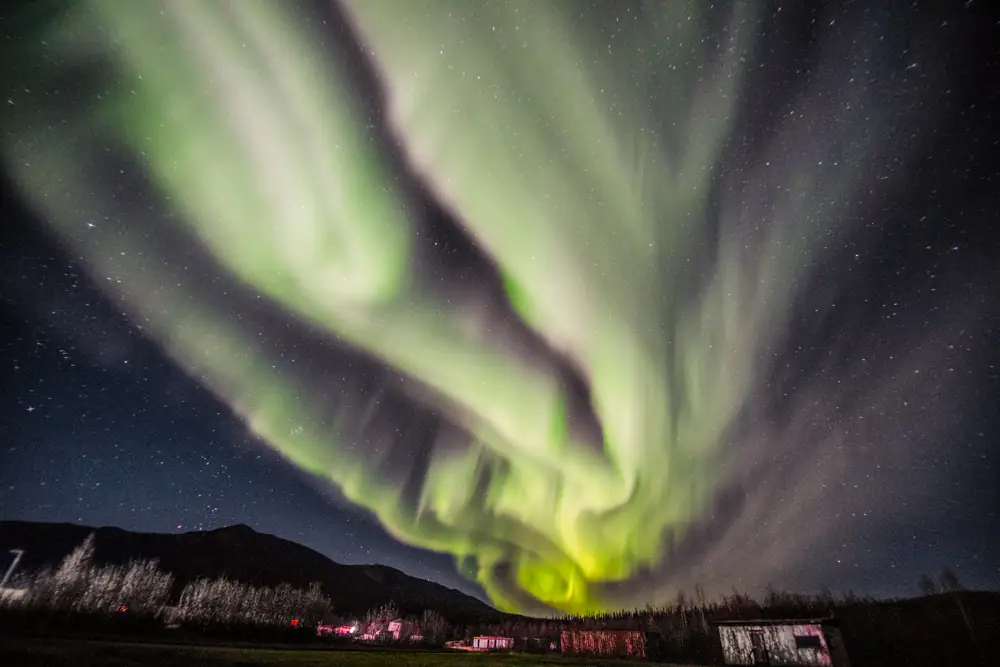

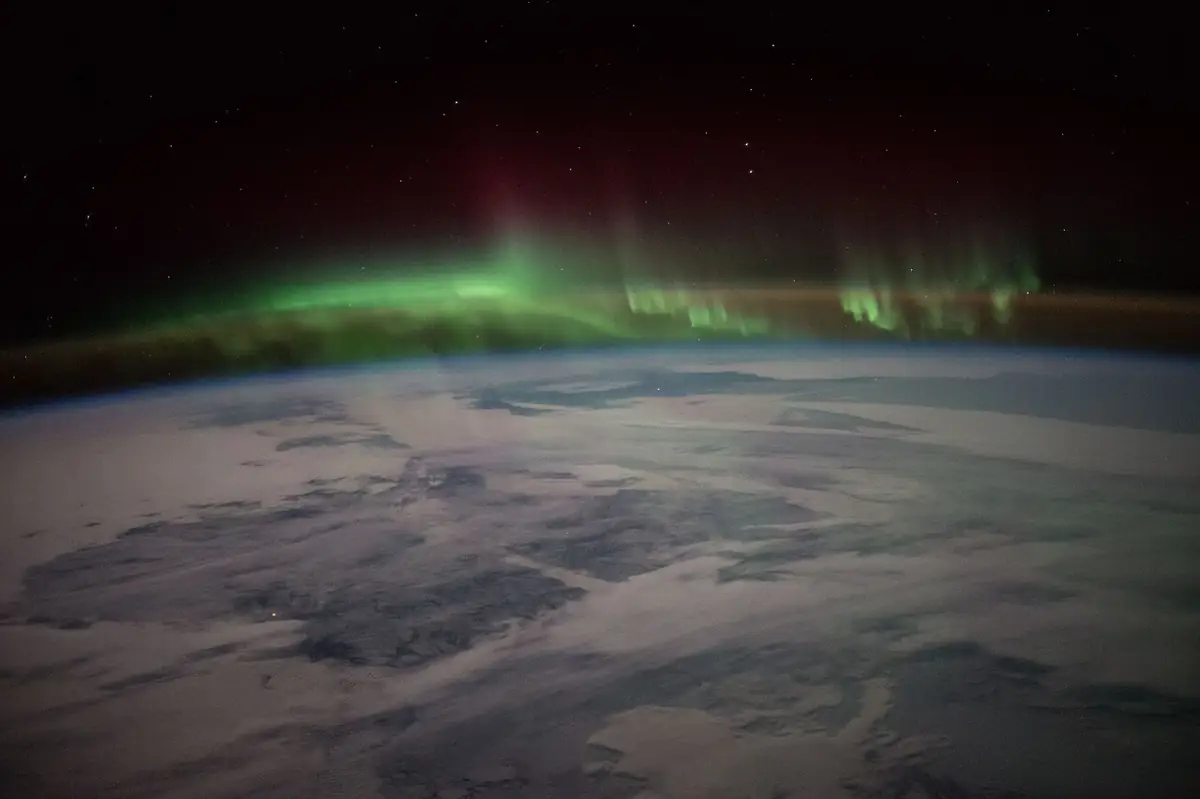







Colour, storm strength and cause
The colours give a rough idea of how strong the storm is and what drove it. Electron energy decides how deep the particles reach: electrons of a few thousand electronvolts or more get down to about 100 km, where they light up green oxygen and, lowest of all, pink nitrogen. Softer electrons of a few hundred electronvolts stop above about 200 km, where they give red light. The red 630 nm oxygen line comes from an excited state that lasts close to two minutes before it emits, so it only appears where the air is thin enough that collisions do not drain the energy first. During big storms the auroral oval moves toward the equator and fills with this soft, high-altitude glow. Viewers far to the south see the tall red upper parts above their northern horizon while the green lower parts stay hidden below it.
| Kp (NOAA G-scale) | Colours usually reported | Usual solar wind driver |
|---|---|---|
| 0 to 4 (below storm level) | Green arcs and curtains near the auroral oval, faint red above them | Background solar wind; high-speed streams from coronal holes, which can come back about every 27 days as the Sun rotates |
| 5 to 6 (G1 to G2) | Brighter, moving green curtains, with purple and pink lower edges where more energetic electrons reach lower altitudes | Strong coronal-hole high-speed streams and the compressed region ahead of them, or moderate coronal mass ejections (CMEs) |
| 7 to 9 (G3 to G5) | Red-dominated aurora far from the poles, often with pink and purple when it reaches overhead; sometimes deep red stable auroral red (SAR) arcs and STEVE | Fast CMEs carrying a strong southward magnetic field (Bz) for hours, often with several CMEs arriving close together |
The photos above show the top row. On 10 to 11 May 2024 a chain of CMEs from sunspot region 3664 produced Kp 9 (G5) and a provisional Kyoto Dst of −406 nT; that is the storm in the Tuntorp and Cape Neddick photos. On 10 October 2024 a CME that followed an X1.8 flare reached Earth with a magnetic field of up to 46 nT and Bz down to −46 nT; Kp reached 9− on the GFZ scale, NOAA rated the storm G4 and Dst reached −333 nT. The Luray, Virginia photo shows its red glow. SAR arcs are a uniform red glow produced as heat flows down from the ring current into the upper atmosphere rather than from incoming electrons. STEVE is a narrow mauve ribbon linked to very fast ion flows below the main oval. Neither follows the colour rules for ordinary aurora.
Caveat: colour is not a strict Kp gauge. What you see also depends on your latitude, the time of night, the moon, haze and the local substorm, and cameras record red and purple much more strongly than the eye does. A quiet night at high latitude can still show red tops, and from Alaska even a strong storm can look mostly green overhead. Measured values: Kp from GFZ Potsdam; Dst (provisional) from WDC for Geomagnetism, Kyoto; solar wind on 10 October 2024 from NOAA SWPC weekly report, 7 to 13 October 2024; May 2024 CMEs from NOAA SWPC. Drivers: NOAA SWPC, Coronal Holes (high-speed streams usually give G1 to G2). Colour and height: NASA Science, Auroras. SAR arcs: Kozyra, Nagy and Slater (1997), Reviews of Geophysics 35, 155–190. STEVE: MacDonald et al. (2018), Science Advances 4, eaaq0030; Gallardo-Lacourt et al. (2018), Geophysical Research Letters 45, 7968–7973; Archer et al. (2019), GRL 46, 6279–6286.
Dated Space-Weather & Forecast Brief Observed G0 / outlook G0
Forecast source policy: following a recorded Nov 6 disagreement, this site provisionally uses NOAA's issued 3-day text for forecast blocks. The 24-hour issue-age limit is a site safety cutoff, not a NOAA freshness standard. Missing or invalid forecast data means unavailable, not G0.
reported provisional 3h Kp, UTC block start 2026-11-20 12:00: 0.33. Observed G is from NOAA scales at Fri Nov 20, 16:08 UTC · 11:08 AM ET · 9:08 AM MT · 8:08 AM PT. Outlook uses the available forecast blocks (up to 48 hours), not an observed storm. The provisional block estimate and minute-by-minute estimate are different products.
Forecast source: NOAA issued 3-day text; issued Fri Nov 20, 12:30 UTC · 7:30 AM ET · 5:30 AM MT · 4:30 AM PT, retrieved 2026-11-20T16:09:29+00:00. A historical source disagreement was recorded Nov 6: Nov 7 00–03 UTC (Nov 6 7–10 PM EST) was Kp 5 in text but 4 in JSON; 03–06 UTC (10 PM Nov 6–1 AM Nov 7 EST) was 4 in text but 5 in JSON. Predictions here use the text, without shifting timestamps.
Auto-updated Fri Nov 20, 16:09 UTC · 11:09 AM ET · 9:09 AM MT · 8:09 AM PTTimestamped summary card combining NOAA SWPC planetary Kp, L1 solar wind, Shue et al. (1998) magnetopause standoff distance, and estimated equatorward aurora horizon reach. Free to link, download or embed (CC0 public domain).
Can I see the aurora from my city tonight? (78 cities + custom latitude)
Select your city—or enter any geographic latitude and longitude—to compute its centered-dipole geomagnetic latitude (WMM2025 pole at 80.85°N, 72.76°W), the minimum Kp needed on the poleward horizon vs overhead, and whether NOAA's live 24-hour Kp outlook reaches your threshold tonight.
Select a city above to compare its geomagnetic latitude with tonight's NOAA Kp forecast.
Want high-odds overhead aurora without waiting for a rare G3–G5 storm? Compare 38 vetted 3★+ aurora resorts, glass igloos & lodges right under the auroral oval (Tromsø, Abisko, Rovaniemi, Saariselkä, Iceland, Fairbanks, Yellowknife, Churchill), where Kp 1–2 is enough whenever skies are clear. Also see our Kp index guide.
All 78 Cities: Geomagnetic Latitudes, Kp Thresholds & Regional Tonight Guides
Every city in our calculator is listed below with its WMM2025 centered-dipole geomagnetic latitude, horizon and overhead Kp thresholds, and a direct link to its dedicated state, province, or region live guide.
| City | Region Group | Geomagnetic Lat | Horizon Kp | Overhead Kp | State / Region Tonight Guide |
|---|---|---|---|---|---|
| Fairbanks, AK Under the auroral oval; overhead displays common at Kp 1–2 |
US — Alaska & West | 65.7°N | Kp 0.5 | Kp 1.0 | Live Alaska Guide → |
| Anchorage, AK South of Fairbanks; active aurora on clear nights at Kp 2–3 |
US — Alaska & West | 61.9°N | Kp 2.0 | Kp 2.5 | Live Alaska Guide → |
| Juneau, AK High geomagnetic latitude; coastal cloud is the main hurdle |
US — Alaska & West | 61.6°N | Kp 2.0 | Kp 3.0 | Live Alaska Guide → |
| Seattle, WA Northern horizon glow in G1–G2 storms (Kp 5–6) |
US — Alaska & West | 53.0°N | Kp 5.5 | Kp 7.0 | Live Washington Guide → |
| Spokane, WA Drier inland skies east of the Cascades; good at Kp 5 |
US — Alaska & West | 53.7°N | Kp 5.0 | Kp 6.5 | Live Washington Guide → |
| Portland, OR Northern horizon during G2+ storms (Kp 6+) |
US — Alaska & West | 50.9°N | Kp 6.5 | Kp 8.0 | Live Oregon Guide → |
| Boise, ID Dark desert/mountain horizons north of town at Kp 6+ |
US — Alaska & West | 49.9°N | Kp 7.0 | Kp 8.5 | Live Idaho Guide → |
| Billings, MT Strong northern-tier US location; horizon aurora at Kp 5 |
US — Alaska & West | 52.9°N | Kp 5.5 | Kp 7.0 | Live Montana Guide → |
| Bozeman, MT High-elevation dark valleys; northern horizon at Kp 5 |
US — Alaska & West | 52.5°N | Kp 5.5 | Kp 7.5 | Live Montana Guide → |
| Cheyenne, WY Requires moderate-to-strong storms (Kp 6.5–7) |
US — Alaska & West | 48.7°N | Kp 7.5 | Kp 9.0 | Live Wyoming Guide → |
| Salt Lake City, UT Northern horizon in strong G3+ storms (Kp 7–7.5) |
US — Alaska & West | 47.6°N | Kp 7.5 | Kp 9.0 | Use calculator ↑ |
| Denver, CO Visible on the northern horizon during G3 storms (Kp 7) |
US — Alaska & West | 47.3°N | Kp 8.0 | Kp 9.0 | Live Colorado Guide → |
| San Francisco, CA Requires severe G4–G5 storms (Kp 8.5–9) for red northern glow |
US — Alaska & West | 43.3°N | Kp 9.0 | Kp 9.0 | Use calculator ↑ |
| Los Angeles, CA Only extreme G5 storms (Kp 9, such as May 2024) reach the horizon |
US — Alaska & West | 40.2°N | Kp 9.0 | Kp 9.0 | Use calculator ↑ |
| Phoenix, AZ Requires extreme G5 geomagnetic storms (Kp 9) |
US — Alaska & West | 40.3°N | Kp 9.0 | Kp 9.0 | Use calculator ↑ |
| Fargo, ND One of the best contiguous US cities due to the North American dipole tilt |
US — Midwest & Plains | 55.1°N | Kp 4.5 | Kp 6.0 | Live North Dakota Guide → |
| Bismarck, ND High geomagnetic latitude (~55°N); horizon aurora at Kp 4.5–5 |
US — Midwest & Plains | 54.7°N | Kp 5.0 | Kp 6.0 | Live North Dakota Guide → |
| Duluth, MN Open northern sightlines across Lake Superior; active at Kp 4.5–5 |
US — Midwest & Plains | 55.3°N | Kp 4.5 | Kp 6.0 | Live Minnesota Guide → |
| Minneapolis–St. Paul, MN Frequent horizon sightings at Kp 5 (G1) away from city glare |
US — Midwest & Plains | 53.4°N | Kp 5.5 | Kp 7.0 | Live Minnesota Guide → |
| Marquette, MI Upper Peninsula shore looking north over Lake Superior; Kp 4.5–5 |
US — Midwest & Plains | 55.3°N | Kp 4.5 | Kp 6.0 | Live Michigan Guide → |
| Madison, WI Visible on the northern horizon at Kp 5.5–6 |
US — Midwest & Plains | 51.8°N | Kp 6.0 | Kp 7.5 | Live Wisconsin Guide → |
| Detroit, MI Look north over Lake Huron / Thumb dark-sky parks at Kp 5.5–6 |
US — Midwest & Plains | 51.3°N | Kp 6.0 | Kp 8.0 | Live Michigan Guide → |
| Chicago, IL Needs Kp 6 and a drive away from urban light pollution |
US — Midwest & Plains | 50.7°N | Kp 6.5 | Kp 8.0 | Live Illinois Guide → |
| Des Moines, IA Open rural horizons; visible at Kp 6 |
US — Midwest & Plains | 50.0°N | Kp 6.5 | Kp 8.5 | Use calculator ↑ |
| Omaha, NE Northern horizon during G2 storms (Kp 6–6.5) |
US — Midwest & Plains | 49.6°N | Kp 7.0 | Kp 8.5 | Use calculator ↑ |
| Indianapolis, IN Visible during G2–G3 storms (Kp 6.5–7) |
US — Midwest & Plains | 48.6°N | Kp 7.5 | Kp 9.0 | Use calculator ↑ |
| St. Louis, MO Requires strong G3 storms (Kp 7) |
US — Midwest & Plains | 47.3°N | Kp 8.0 | Kp 9.0 | Use calculator ↑ |
| Kansas City, MO Northern horizon in G3 storms (Kp 7) |
US — Midwest & Plains | 47.5°N | Kp 8.0 | Kp 9.0 | Use calculator ↑ |
| Dallas, TX Requires G4–G5 severe storms (Kp 8.5–9) for red horizon glow |
US — Midwest & Plains | 41.0°N | Kp 9.0 | Kp 9.0 | Use calculator ↑ |
| Houston, TX Requires extreme G5 storms (Kp 9) |
US — Midwest & Plains | 38.1°N | Kp 9.0 | Kp 9.0 | Use calculator ↑ |
| Caribou / Presque Isle, ME High geomagnetic latitude (~55.9°N) and dark Aroostook skies; Kp 4.5 |
US — East & South | 56.0°N | Kp 4.5 | Kp 5.5 | Live Maine Guide → |
| Burlington, VT Strong New England location; northern horizon at Kp 5 |
US — East & South | 53.6°N | Kp 5.5 | Kp 7.0 | Live Vermont Guide → |
| Portland, ME Visible at Kp 5–5.5 from dark sites north of town |
US — East & South | 52.8°N | Kp 5.5 | Kp 7.0 | Live Maine Guide → |
| Buffalo, NY Northern horizon across Lake Ontario during Kp 5.5–6 storms |
US — East & South | 52.0°N | Kp 6.0 | Kp 7.5 | Live New York Guide → |
| Boston, MA Visible at Kp 6 from dark coastal or inland viewpoints |
US — East & South | 51.5°N | Kp 6.0 | Kp 8.0 | Live Massachusetts Guide → |
| New York City, NY Needs Kp 6.5 (G2–G3) and a dark northern horizon away from city glare |
US — East & South | 49.9°N | Kp 7.0 | Kp 8.5 | Live New York Guide → |
| Philadelphia, PA Northern horizon in G3 storms (Kp 6.5–7) |
US — East & South | 49.1°N | Kp 7.0 | Kp 9.0 | Live Pennsylvania Guide → |
| Pittsburgh, PA Visible on the northern horizon at Kp 6.5 |
US — East & South | 49.5°N | Kp 7.0 | Kp 9.0 | Live Pennsylvania Guide → |
| Washington, DC Visible from dark sites (e.g. Shenandoah) during Kp 7–7.5 storms |
US — East & South | 48.0°N | Kp 7.5 | Kp 9.0 | Use calculator ↑ |
| Charlottesville / Scottsville, VA Central Virginia (~47°N geomagnetic): red/green horizon glow at Kp 7.5–8 (as in May & Oct 2024) |
US — East & South | 46.9°N | Kp 8.0 | Kp 9.0 | Use calculator ↑ |
| Raleigh, NC Requires G4 storms (Kp 8–8.5) |
US — East & South | 44.9°N | Kp 9.0 | Kp 9.0 | Use calculator ↑ |
| Atlanta, GA Requires severe G4–G5 storms (Kp 8.5–9) |
US — East & South | 42.7°N | Kp 9.0 | Kp 9.0 | Use calculator ↑ |
| Nashville, TN Northern horizon in G4 storms (Kp 8) |
US — East & South | 45.0°N | Kp 9.0 | Kp 9.0 | Use calculator ↑ |
| Miami, FL Extreme G5 storms only (Kp 9) |
US — East & South | 34.8°N | Kp 9.0 | Kp 9.0 | Use calculator ↑ |
| Yellowknife, NT Directly under the auroral oval (~69°N geomagnetic); overhead at Kp 0–2 |
Canada | 68.5°N | Kp 0.0 | Kp 0.0 | Live Northern Canada Guide → |
| Churchill, MB Sub-60° geographic but ~68°N geomagnetic; overhead at Kp 0–2 |
Canada | 67.1°N | Kp 0.0 | Kp 0.0 | Live Northern Canada Guide → |
| Whitehorse, YT Core auroral zone; overhead curtains at Kp 2–3 |
Canada | 63.8°N | Kp 1.0 | Kp 2.0 | Live Northern Canada Guide → |
| Edmonton, AB High geomagnetic latitude (~60.4°N); frequent aurora at Kp 2.5–3 |
Canada | 60.0°N | Kp 2.5 | Kp 3.5 | Live Alberta Guide → |
| Calgary, AB Visible on most active nights (Kp 3.5–4) |
Canada | 57.4°N | Kp 3.5 | Kp 5.0 | Live Alberta Guide → |
| Winnipeg, MB Very high geomagnetic latitude (~58.6°N); active at Kp 3–4 |
Canada | 58.0°N | Kp 3.5 | Kp 4.5 | Use calculator ↑ |
| Vancouver, BC Northern horizon at Kp 4.5–5 when coastal skies are clear |
Canada | 54.5°N | Kp 5.0 | Kp 6.5 | Live British Columbia Guide → |
| Toronto, ON Strong geomagnetic boost (~52.8°N); visible outside city lights at Kp 5.5 |
Canada | 52.7°N | Kp 5.5 | Kp 7.0 | Live Ontario Guide → |
| Ottawa, ON Frequent displays at Kp 5 |
Canada | 54.6°N | Kp 5.0 | Kp 6.5 | Live Ontario Guide → |
| Montreal, QC Visible on the northern horizon at Kp 5 |
Canada | 54.6°N | Kp 5.0 | Kp 6.5 | Live Quebec Guide → |
| Halifax, NS Northern horizon at Kp 5–5.5 |
Canada | 53.7°N | Kp 5.0 | Kp 6.5 | Use calculator ↑ |
| Tromsø, Norway Directly beneath the European auroral oval; overhead at Kp 1–2 |
Europe | 67.5°N | Kp 0.0 | Kp 0.0 | Live Norway Guide → |
| Alta, Norway Core auroral oval with drier inland fjord skies; overhead at Kp 1–2 |
Europe | 67.2°N | Kp 0.0 | Kp 0.0 | Live Norway Guide → |
| Svolvær (Lofoten), Norway Under the auroral oval; overhead at Kp 1–3 |
Europe | 66.9°N | Kp 0.0 | Kp 0.5 | Live Norway Guide → |
| Longyearbyen (Svalbard), Norway North of the quiet midnight oval; daytime cusp aurora in polar night |
Europe | 75.3°N | Kp 0.0 | Kp 0.0 | Live Norway Guide → |
| Abisko / Kiruna, Sweden Rain-shadow microclimate right under the oval; Kp 1–3 |
Europe | 66.3°N | Kp 0.0 | Kp 0.5 | Live Sweden & Finland Guide → |
| Rovaniemi, Finland On the Arctic Circle; horizon at Kp 1, overhead at Kp 2.5–3 |
Europe | 63.6°N | Kp 1.0 | Kp 2.0 | Live Sweden & Finland Guide → |
| Inari / Saariselkä, Finland Deep under the oval in northern Lapland; overhead at Kp 1–2 |
Europe | 65.7°N | Kp 0.5 | Kp 1.0 | Live Sweden & Finland Guide → |
| Reykjavík, Iceland Inside the auroral zone (~65.5°N geomagnetic); overhead at Kp 1.5–3 |
Europe | 68.8°N | Kp 0.0 | Kp 0.0 | Live Iceland Guide → |
| Akureyri, Iceland North Iceland rain shadow; overhead at Kp 1–3 |
Europe | 69.6°N | Kp 0.0 | Kp 0.0 | Live Iceland Guide → |
| Inverness, Scotland, UK Northern Scotland; horizon aurora at Kp 3.5–4, overhead in G2+ storms |
Europe | 59.7°N | Kp 3.0 | Kp 4.0 | Live Scotland & UK Guide → |
| Edinburgh, Scotland, UK Northern horizon at Kp 4–5 |
Europe | 58.1°N | Kp 3.5 | Kp 4.5 | Live Scotland & UK Guide → |
| Dublin, Ireland Northern horizon during G1–G2 storms (Kp 5–5.5) |
Europe | 56.1°N | Kp 4.0 | Kp 5.5 | Live Scotland & UK Guide → |
| Oslo, Norway Southern Norway; visible at Kp 3.5–4.5 |
Europe | 59.7°N | Kp 3.0 | Kp 4.0 | Live Norway Guide → |
| Stockholm, Sweden Visible on clear nights at Kp 4–5 |
Europe | 58.0°N | Kp 3.5 | Kp 4.5 | Live Sweden & Finland Guide → |
| Helsinki, Finland Visible across southern Finland at Kp 4–5 |
Europe | 57.8°N | Kp 3.5 | Kp 4.5 | Live Sweden & Finland Guide → |
| London, UK Requires strong G2–G3 storms (Kp 5.5–6.5) outside urban light domes |
Europe | 53.4°N | Kp 5.5 | Kp 7.0 | Live Scotland & UK Guide → |
| Berlin, Germany Requires G2–G3 storms (Kp 6–6.5) |
Europe | 52.2°N | Kp 6.0 | Kp 7.5 | Use calculator ↑ |
| Paris, France Requires G3 storms (Kp 6.5–7.5) |
Europe | 50.4°N | Kp 6.5 | Kp 8.5 | Use calculator ↑ |
| Hobart, Tasmania, Australia High southern geomagnetic latitude (~50°S); southern horizon at Kp 6–6.5 |
Southern Hemisphere | 49.5°S | Kp 7.0 | Kp 9.0 | Live Tasmania & Australia Guide → |
| Melbourne, Australia Southern coastal horizon during G3–G4 storms (Kp 7.5–8) |
Southern Hemisphere | 44.8°S | Kp 9.0 | Kp 9.0 | Live Tasmania & Australia Guide → |
| Dunedin / Queenstown, New Zealand Prime Aurora Australis base; southern horizon at Kp 6–6.5 |
Southern Hemisphere | 49.3°S | Kp 7.0 | Kp 9.0 | Live New Zealand Guide → |
| Christchurch, New Zealand Visible on the southern horizon at Kp 7 |
Southern Hemisphere | 46.7°S | Kp 8.0 | Kp 9.0 | Live New Zealand Guide → |
| Ushuaia, Argentina Lower geomagnetic latitude (~45.6°S) due to dipole tilt away from South America; needs Kp 8 |
Southern Hemisphere | 45.7°S | Kp 8.5 | Kp 9.0 | Use calculator ↑ |
When and how to look
Face north after full darkness. Aim for the hours around NOAA's strongest forecast block when one is listed above; activity can continue later if the storm holds. Get away from city lights, and give your eyes 15–20 minutes to adapt. A phone camera on a long exposure often shows aurora that looks faint or grey to the eye.
Learn more, embed our live widget & plan an aurora trip
- Where to stay & tour for the aurora: 38 vetted 3★+ hotels, glass igloos and lodges across 14 high-latitude destinations
- Free Embeddable Live Space Weather & Magnetic Shield Widget: Add our live NOAA Kp, solar wind & aurora reach card to your astronomy club, weather blog, or classroom site
- What the Kp index means for seeing the aurora
- Best US places and times to see the aurora
- How to see the northern lights in the US
- Storm log: dated posts for NOAA G1+ storms and watches
Also coming up in the sky
- Meteors Geminids meteor shower peak
Dec 14, 14:00 UTC · 9:00 AM ET · 7:00 AM MT · 6:00 AM PT
ZHR 150; Moon 25% lit · 2026 viewing guide → - Season December solstice
Dec 21, 20:50 UTC · 3:50 PM ET · 1:50 PM MT · 12:50 PM PT - Moon Supermoon (full Moon near perigee)
Dec 24, 01:28 UTC · 8:28 PM ET, Dec 23 · 6:28 PM MT, Dec 23 · 5:28 PM PT, Dec 23
356,738 km (221,667 mi) from Earth
All eclipses, meteor showers and sky events for the next two years →
Book a guided aurora tour
A guide does the driving, the forecast-watching and the hunt for clear skies, which helps most if you are visiting and don't know the area. A high Kp is only part of the picture: clear, dark skies decide most nights.
- No tour can guarantee aurora. Plan more than one night if you can. Treat any promise of a guaranteed sighting with caution.
- Prefer tours with a clear weather, cancellation or "no aurora" policy, and read it before you pay.
- Check the forecast first: our Kp index guide and NOAA SWPC's 3-day forecast and 30-minute aurora forecast.
- Arctic winter nights can be extremely cold. Check what clothing or gear the tour provides.
Alaska
- Aurora chasing with photography Viator · Fairbanks, Alaska · about 4 hours. A shorter evening chase, with help taking aurora photos.
- SkyChase Northern Lights Experience Viator · Fairbanks, Alaska · about 5 hours. A mid-length night chase around the Fairbanks area.
- Fairbanks northern lights tours (search) Viator · Compare aurora trips from Fairbanks side by side.
- Fairbanks northern lights tours (search) GetYourGuide · A second marketplace to compare Fairbanks aurora trips.
- Anchorage northern lights tours (search) Viator · Compare aurora trips that start in Anchorage.
Tours are listed on Viator (a Tripadvisor company) and GetYourGuide. Latitudes are approximate. Durations, where shown, are approximate and come from the operators. Prices, availability and reviews change, so check them on the booking page.
FTC affiliate disclosure: Tour links above go to Viator (a Tripadvisor company) and GetYourGuide. If you book through them, Solar Evidence may earn a commission at no extra cost to you. All affiliate links carry rel="sponsored nofollow noopener". We don't run these tours; check reviews, cancellation terms and the forecast before booking. Commissions never affect our evidence ratings. Affiliate policy.