What the roughly 11-year solar cycle is, how sunspot numbers are counted, where Solar Cycle 25 stands using live NOAA data, and why forecasting cycles is hard.
What the cycle is
The 11-year sunspot rhythm: The number of sunspots rises and falls over roughly 11 years. The peak is called solar maximum and the low point solar minimum. Cycles are numbered from Cycle 1, which began in 1755. [1]
The 22-year magnetic pole flip: A new cycle is considered to have started when sunspot groups begin appearing at high solar latitudes with leading-spot magnetic polarity opposite to the previous cycle's. [1] The Sun's overall magnetic poles flip near each maximum, so a full magnetic cycle takes about 22 years. [2][3]
Historical perspective: Galileo, Baliani and the first idea that the Sun can change
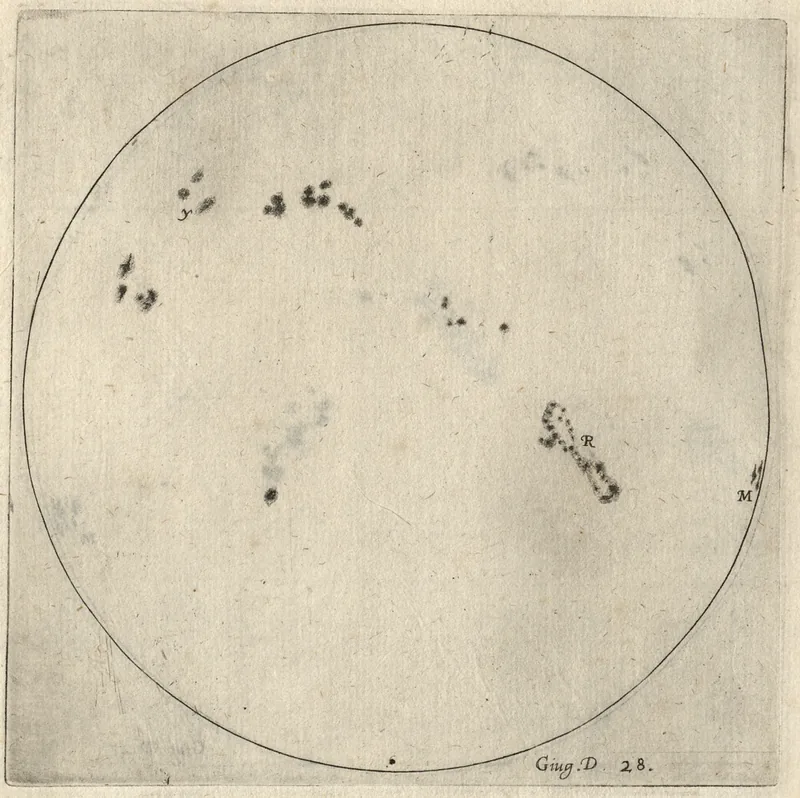
Historical perspective: A 2026 essay by Berrilli and Penza looks at a letter that Giovanni Battista Baliani sent to Galileo on 31 January 1614. Baliani asked if sunspots, and the bright patches Galileo had described in his 1613 book, could change how much heat the Sun sends us. The authors call this "arguably the first scientific hypothesis of solar variability on record." The essay is a history piece. We could not confirm that it was peer reviewed. [10]
Historical perspective: a 1567 eclipse and an upper limit on the Sun's radius
Historical perspective: A 2026 study by Hayakawa and colleagues re-reads two eclipse reports by the astronomer Christoph Clavius, from 1560 and 1567. If the 1567 eclipse at Rome was total, the Sun's radius was at most 696,200 km. The authors say this indicates no steady shrinking of the Sun, but slow changes over centuries are still possible. [11]
How sunspots are counted
How astronomers count sunspots: The official international sunspot number comes from the World Data Center SILSO at the Royal Observatory of Belgium. The classic formula counts each group as 10 plus 1 for each individual spot, so a Sun with any spots at all scores at least 11. [1][4]
On 1 July 2015 SILSO replaced the historical series with a recalibrated Version 2.0, which corrects several inconsistencies in the past record and uses a new reference scale. Clette et al. (2014) review the problems behind the revision. Figures quoted from before and after 2015 may therefore not be directly comparable. [7][5]
Where Solar Cycle 25 stands
Cycle 24 started in December 2008, peaked in April 2014 and ended in December 2019, which was also the start of Cycle 25. [1] NASA and NOAA announced in October 2024 that the Sun had entered the maximum period of Cycle 25. [3]
In NOAA's smoothed series, Cycle 25 has reached 160.9 (2024-10), compared with Cycle 24's peak of 116.4 (2014-04). The latest monthly value is 45.7 for 2026-10 (preliminary). Smoothed values lag by about six months, so the true peak is only confirmed later. [6]
For the forecasting debate, including how the 2019 panel consensus compared with what happened, see our claim page on the Solar Cycle 25 prediction debate.
Why it matters
Active regions around sunspots produce most significant flares and CMEs, so space weather events, and auroras at lower latitudes, are more frequent around maximum. [1][3] Hathaway's review covers the cycle's observed regularities and the open problems in predicting it. [2]
Big flares often pulse: India's Aditya-L1 spacecraft watched 34 X-class flares, the strongest class, from July 2024 to March 2026. A 2026 study found X-ray pulses in 25 of 34 X-class flares, typically every 1.3–1.7 minutes. The authors say this fits the idea that magnetic field lines snap and rejoin over and over during a flare. [8]
Measured: not all X flares stir the upper air the same way: In a 2026 study, three of four X-class flares in November 2025 lifted electron levels in the sunlit upper air for 20 to 30 minutes. For one X1.7 flare, the team saw no detectable change in those electron levels, and they link this to its weak ultraviolet light. [9]
Kanaujiya, S. R. et al. (2026). Hard X-Ray Quasiperiodic Pulsations in X-class Solar Flares Observed by Aditya-L1/HEL1OS. The Astrophysical Journal 1011: 63. doi:10.3847/1538-4357/aeaa40
Liu, L. & Zou, S. (2026). Global Ionospheric Responses to Four X-Class Solar Flares in November 2025. Space Weather 24(11): e2026SW005116. doi:10.1029/2026SW005116
Berrilli, F. & Penza, V. (2026). From Galileo's Observations to Baliani's Hypothesis: An Early Seventeenth-Century Debate on Solar Variability. Solar Physics 301: 165 (Perspective article; peer review not confirmed). doi:10.1007/s11207-026-02758-3
Hayakawa, H., Sôma, M., Rozelot, J.-P., Murata, K., Pevtsov, A. A., Gunár, S. & Green, L. M. (2026). Analyses on Christoph Clavius's Reports of Total Solar Eclipses in 1560 and 1567: Key References for the Centennial Variations of the Earth's Rotation Speed and the Solar Radius. ApJL 1011(2), L58 (CC BY 4.0). doi:10.3847/2041-8213/ae84b7
Nearest Star: The Surprising Science of Our Sun (2nd ed.)
Leon Golub & Jay M. Pasachoff · ISBN 9781107672642
A clear, readable tour of how the Sun works from the inside out. Two veteran solar astronomers explain core nuclear fusion, the 11-year sunspot cycle, solar flares, and billion-ton coronal mass ejections.
Why this book matters to both sides
Gives the standard physics baseline for how the Sun generates heat and magnetic storms. That you can compare against alternative Electric Sun and superflare ideas.
Mainstream Baseline2026★ New Oct 2026 · Harvard Univ. Press
The Turbulent Sun: A Natural History of Our Cosmic Origins and Future
Leon Golub · ISBN 9780674292444
Harvard–Smithsonian solar physicist Leon Golub explains how the solar wind carves out a giant magnetic bubble around our solar system. He shows how Earth's magnetic shield protects our air while unshielded planets lose theirs.
Why this book matters to both sides
Provides the latest spacecraft findings (from Parker Solar Probe and Voyager) on how magnetic fields shield planetary atmospheres over billions of years.
Joanna D. Haigh & Peter Cargill · ISBN 9780691153841
Two physicists explain how much the Sun's brightness and ultraviolet rays actually change over the 11-year sunspot cycle. They also test how much quiet-Sun periods (like the 1600s Maunder Minimum) cool Earth's climate.
Why this book matters to both sides
Directly addresses the 'Grand Solar Minimum / Mini Ice Age' debate using satellite measurements of solar output and upper-air winds.
Forgotten Civilization: New Discoveries on the Solar-Induced Dark Age (Revised ed.)
Robert M. Schoch with Catherine Ulissey · ISBN 9781644112922
Boston University geologist Robert Schoch presents his water-weathering case for an older Great Sphinx alongside his Leading Edge hypothesis that giant solar outbursts around 9700 BCE melted the Ice Age glaciers.
Why this book matters to both sides
The primary Leading Edge book arguing that an extreme solar superstorm—rather than a comet impact—ended the last Ice Age and left plasma patterns in ancient rock art.
FTC affiliate disclosure: Book links above go to Bookshop.org (Affiliate ID 130218, shop Search for the Truth), which supports independent bookstores. If you buy through one of these links, Solar Evidence earns a 10% commission at no extra cost to you. All affiliate links carry rel="sponsored nofollow noopener". Every recommended title is verified in print and meets our 4.3+/5 reader or landmark scholarly reputation standard; commissions never influence our evidence labels. Affiliate policy.
Sources were checked on 2026-10-24. Text on this page is original. Quoted figures are attributed and linked to the source. General education only, not for safety or operational decisions. Disclaimer.